;}.cls-6{fill:%23fff;}.cls-7{fill:%2339f;}%3c/style%3e%3cclipPath%20id='clippath'%3e%3cpath%20class='cls-6'%20d='m681.73,372.35c0,282.5-286.05,445.9-424.39,507.51v-179.27C111.37,662.76,3.6,530.13,3.6,372.35,3.6,185.08,155.41,33.28,342.67,33.28s339.07,151.81,339.07,339.07h-.01Z'/%3e%3c/clipPath%3e%3c/defs%3e%3cg%20class='cls-2'%3e%3cg%20class='cls-2'%3e%3cpath%20d='m997.93,666.39l-152-386.4h129.6l87.2,244.8,88-244.8h130.4l-152,386.4h-131.2Z'/%3e%3cpath%20d='m1292.32,472.79c0-108.8,79.2-202.4,210.4-202.4s211.2,93.6,211.2,202.4-78.4,203.2-211.2,203.2-210.4-94.4-210.4-203.2Zm295.2,0c0-51.2-30.4-93.6-84.8-93.6s-83.2,42.4-83.2,93.6,29.6,94.4,83.2,94.4,84.8-42.4,84.8-94.4Z'/%3e%3cpath%20d='m1769.91,160.79c0-39.2,31.2-70.4,70.4-70.4s70.4,31.2,70.4,70.4-31.2,70.4-70.4,70.4-70.4-31.2-70.4-70.4Zm8.8,505.6v-386.4h123.2v386.4h-123.2Z'/%3e%3cpath%20d='m1977.1,666.39v-90.4l155.2-188.8h-155.2v-107.2h322.4v87.2l-158.4,192.8h161.6v106.4h-325.6Z'/%3e%3cpath%20d='m2557.89,270.39c114.4,0,197.6,84,197.6,215.2v26.4h-275.2c7.2,36,40.8,68.8,98.4,68.8,34.4,0,72.8-13.6,94.4-32.8l52,76.8c-38.4,34.4-102.4,51.2-161.6,51.2-119.2,0-211.2-77.6-211.2-203.2,0-112,84.8-202.4,205.6-202.4Zm-79.2,161.6h159.2c-3.2-27.2-23.2-66.4-80-66.4-53.6,0-74.4,38.4-79.2,66.4Z'/%3e%3c/g%3e%3c/g%3e%3cg%20class='cls-5'%3e%3cg%3e%3ccircle%20id='c3'%20class='cls-3'%20cx='253.67'%20cy='433.07'%20r='484.38'/%3e%3ccircle%20id='c2'%20class='cls-4'%20cx='83.67'%20cy='428.07'%20r='484.38'/%3e%3ccircle%20id='c1'%20class='cls-7'%20cx='-36.33'%20cy='494.63'%20r='484.38'/%3e%3ccircle%20id='c0'%20class='cls-1'%20cx='-141.33'%20cy='604.68'%20r='484.38'/%3e%3c/g%3e%3c/g%3e%3c/svg%3e)
Teaching Prometheus and OpenTelemetry-collector to be friends
elevator pitch
voize develops speech recognition for healthcare professionals.
Nurses in Germany spent 30% of their time on administrative tasks instead of direct patient care.
With voize, nurses can just freely speak any medical report into our app and we generate the structured medical records. These are directly transferred into their existing healthcare record systems.
This way, voize allows profressionals to save time on administrative tasks and focus on patient wellbeing.

Motivation
At voize we want to have a consistent monitoring experience for all workloads across all of our clusters. Building features and improvements for our app often requires making changes to various services deployed in different places and using different stacks. An engineer might for example want add a new model or capability to our ML inference service, or they might be making a change to our data labeling service and working with our data team to create new data, or they might be working on a new ETL job to reshape existing data and train a new ASR or NLP model. By having good charts and dashboards in Grafana which can then be used by our engineers no matter what system they're working on at the moment, we make it easier to learn, practice and remember how to monitor our infra and systems and how to diagnose problems.
We use Grafana as our main tool for infrastructure monitoring, which allows us to monitor our internal and public-facing services as well as machine learning and ETL jobs all from the same place. We use Kubernetes to orchestrate our workloads, which are currently run in two clusters: one EKS cluster, and one on-premises cluster using K3s. Grafana lives in our EKS cluster, and is connected to Prometheus deployed via kube-prometheus-stack to collect metrics there. In our on-prem cluster, we use opentelemetry-collector to collect metrics.

Cross-cluster metrics collection setup
In order to visualize workloads across both our clusters, we label all metrics data points with a cluster label, which can then be used in Grafana dashboards to navigate and filter the data appropriately. You can do this by adding relabeling rules to the various metrics sources, or by setting global relabeling rules in your default ScrapeClass. In the kube-prometheus-stack Helm chart, you can use the prometheus.prometheusSpec.scrapeClasses value to configure the additional label:
spec:
  values:
    prometheus:
      prometheusSpec:
        scrapeClasses:
          - name: default
            default: true
            relabelings:
              - targetLabel: cluster
                replacement: 'voize-eks'
We set up this label for all the collectors, and then in our dashboards add filters to select the cluster. For example:
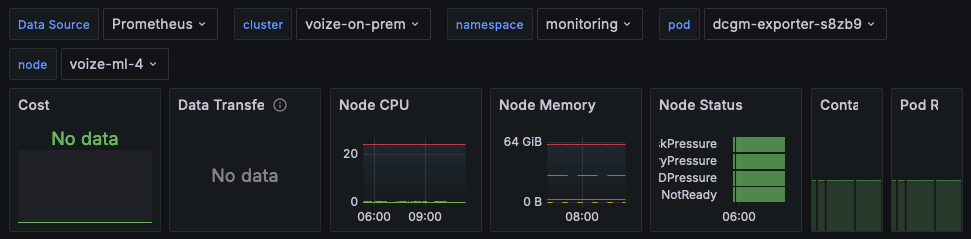
In the on-prem cluster, opentelemetry-collector is deploying using its Helm chart and set up to export metrics to an opentelemetry-collector instance running in the EKS cluster, which in turn exports them into Prometheus, which is connected to Grafana. opentelemetry-collector is designed to be a drop-in replacement for Prometheus, meaning you can use the same scrape_config configuration syntax to set it up. The one catch is that you need to escape dollar sign characters ($) in regex substitutions with a second dollar sign ($$). Here’s our setup:
spec:
  values:
    config:
      receivers:
        prometheus:
          config:
            scrape_configs:
            - job_name: 'kubernetes-apiservers'
              kubernetes_sd_configs:
              - role: endpoints
              scheme: https
              tls_config:
                ca_file: /var/run/secrets/kubernetes.io/serviceaccount/ca.crt
              bearer_token_file: /var/run/secrets/kubernetes.io/serviceaccount/token
              relabel_configs:
              - source_labels: [__meta_kubernetes_namespace, __meta_kubernetes_service_name, __meta_kubernetes_endpoint_port_name]
                action: keep
                regex: default;kubernetes;https
              - target_label: cluster
                replacement: 'voize-on-prem'
            - job_name: 'kubernetes-cadvisor'
              scheme: https
              tls_config:
                ca_file: /var/run/secrets/kubernetes.io/serviceaccount/ca.crt
              bearer_token_file: /var/run/secrets/kubernetes.io/serviceaccount/token
              kubernetes_sd_configs:
              - role: node
              relabel_configs:
              - action: labelmap
                regex: __meta_kubernetes_node_label_(.+)
              - target_label: __address__
                replacement: kubernetes.default.svc:443
              - source_labels: [__meta_kubernetes_node_name]
                regex: (.+)
                target_label: __metrics_path__
                replacement: /api/v1/nodes/$$1/proxy/metrics/cadvisor
              - target_label: cluster
                replacement: 'voize-on-prem'
            - job_name: 'kubernetes-nodes'
              scheme: https
              tls_config:
                ca_file: /var/run/secrets/kubernetes.io/serviceaccount/ca.crt
              bearer_token_file: /var/run/secrets/kubernetes.io/serviceaccount/token
              kubernetes_sd_configs:
              - role: node
              relabel_configs:
              - action: labelmap
                regex: __meta_kubernetes_node_label_(.+)
              - target_label: __address__
                replacement: kubernetes.default.svc:443
              - source_labels: [__meta_kubernetes_node_name]
                regex: (.+)
                target_label: __metrics_path__
                replacement: /api/v1/nodes/$$1/proxy/metrics
              - target_label: cluster
                replacement: 'voize-on-prem'
            - job_name: 'kubernetes-pods' # scrape pods with the annotation "prometheus.io/scrape" set to "true"
              kubernetes_sd_configs:
              - role: pod
              honor_labels: true
              relabel_configs:
              - source_labels: [__meta_kubernetes_pod_annotation_prometheus_io_scrape]
                action: keep
                regex: true
              - source_labels: [__meta_kubernetes_pod_annotation_prometheus_io_path]
                action: replace
                target_label: __metrics_path__
                regex: (.+)
              - source_labels: [__address__, __meta_kubernetes_pod_annotation_prometheus_io_port]
                action: replace
                regex: ([^:]+)(?::\d+)?;(\d+)
                replacement: $$1:$$2
                target_label: __address__
              - source_labels: [__meta_kubernetes_namespace]
                action: replace
                target_label: namespace
              - source_labels: [__meta_kubernetes_pod_name]
                action: replace
                target_label: pod
              - source_labels: [__meta_kubernetes_pod_node_name]
                action: replace
                target_label: node
              - target_label: cluster
                replacement: 'voize-on-prem'
            - job_name: 'kubernetes-service-endpoints' # scrape endpoints with the prometheus.io/scrape annotation set to true
              kubernetes_sd_configs:
              - role: endpoints
              honor_labels: true
              relabel_configs:
              - source_labels: [__meta_kubernetes_service_annotation_prometheus_io_scrape]
                action: keep
                regex: true
              - source_labels: [__meta_kubernetes_service_annotation_prometheus_io_scheme]
                action: replace
                target_label: __scheme__
                regex: (https?)
              - source_labels: [__meta_kubernetes_service_annotation_prometheus_io_path]
                action: replace
                target_label: __metrics_path__
                regex: (.+)
              - source_labels: [__address__, __meta_kubernetes_service_annotation_prometheus_io_port]
                action: replace
                target_label: __address__
                regex: ([^:]+)(?::\d+)?;(\d+)
                replacement: $$1:$$2
              - source_labels: [__meta_kubernetes_namespace]
                action: replace
                target_label: namespace
              - source_labels: [__meta_kubernetes_service_name]
                action: replace
                target_label: service
              - source_labels: [__meta_kubernetes_pod_name]
                action: replace
                target_label: pod
              - source_labels: [__meta_kubernetes_pod_node_name]
                action: replace
                target_label: node
              - target_label: cluster
                replacement: 'voize-on-prem'
Notice how every scraper job has a rule adding a new cluster label with the appropriate value, matching the configuration in the EKS cluster so that all data points are appropriately labeled.
The kubernetes-cadvisor and kubernetes-service-endpoints jobs scrape per-container resource utilization and resource requests/limits, respectively, the latter via the kube-state-metrics service. These metrics are used in the default kubernetes-mixin dashboards included with kube-prometheus-stack to create various visualizations for resource utilization at different aggregation levels.
Building cluster-agnostic Grafana charts and dashboards
In theory, this means that the default dashboards should now work for both clusters, as all the relevant metrics are exposed. Unfortunately, when looking at e.g. the Kubernetes / Compute Resources / Namespace (Pods) default dashboard, there was no information available from the on-premises cluster. Upon closer inspection, we realized that the kubernetes-mixin dashboards include additional filters in their definitions which make assumptions about the specific metrics collection setup used by Prometheus. For example, the CPU Usage chart uses the following query:
sum(
  node_namespace_pod_container:container_cpu_usage_seconds_total:sum_irate{cluster="$cluster", namespace="$namespace"}
) by (pod)
The metric being aggregated here is a Prometheus recording rule — we can take a look at its definition by looking in the Prometheus rules ConfigMap:
$ kubectl get cm/prometheus-prometheus-prometheus-rulefiles-0 -n monitoring -o yaml
In there, node_namespace_pod_container:container_cpu_usage_seconds_total:sum_irate is defined as follows:
spec:
  groups:
  - name: k8s.rules
    rules:
    - expr: |-
        sum by (cluster, namespace, pod, container) (
          irate(container_cpu_usage_seconds_total{job="kubelet", metrics_path="/metrics/cadvisor", image!=""}[5m])
        ) * on (cluster, namespace, pod) group_left(node) topk by (cluster, namespace, pod) (
          1, max by(cluster, namespace, pod, node) (kube_pod_info{node!=""})
        )
      record: node_namespace_pod_container:container_cpu_usage_seconds_total:sum_irate
      {{- if or .Values.defaultRules.additionalRuleLabels .Values.defaultRules.additionalRuleGroupLabels.k8s }}
      labels:
        {{- with .Values.defaultRules.additionalRuleLabels }}
          {{- toYaml . | nindent 8 }}
        {{- end }}
        {{- with .Values.defaultRules.additionalRuleGroupLabels.k8s }}
          {{- toYaml . | nindent 8 }}
        {{- end }}
      {{- end }}
The problematic part is here: container_cpu_usage_seconds_total{job="kubelet", metrics_path="/metrics/cadvisor", image!=""}
The container_cpu_usage_seconds_total metric is well known, and being collected correctly by our OpenTelemetry setup, but the recording rule (and therefore the dashboard) are filtering on a specific collection job name, kubelet, and metrics_path, /metrics/cadvisor. For our on-prem setup, the job happens to be called kubernetes-cadvisor instead, and the metrics path is /api/v1/nodes/$$1/proxy/metrics/cadvisor (with $$1 being replaced by the node name). Other than these differences, the metrics values are being collected and reported fine - they just don’t show up in the charts due to this filter.
To fix this, we considered two options:
-
Reshape our OpenTelemetry collector data to match the expectations of the recording rules/dashboards, by changing the job names in the OpenTelemetry collector config and adding label rewrite rules to set
metrics_pathto the expected value. -
Change the recording rules and dashboards to remove the additional filters.
We chose to go with the second option, as we don’t want to have to tweak all our collector deployments to match the implementation details of Prometheus.
Making default Prometheus recording rules compatible with OpenTelemetry-collector
To remove filters embedded in Grafana, you can simply edit the chart definitions. The recording rule is a bit more complicated, as it gets created by the kube-prometheus-stack Helm chart. To change it, you need to disable the rule creation in the Helm chart, by setting:
spec:
  values:
    defaultRules:
      rules:
        k8sContainerCpuUsageSecondsTotal: false
        k8sContainerMemoryCache: false
        k8sContainerMemoryRss: false
        k8sContainerMemorySwap: false
        k8sContainerResource: false
        k8sContainerMemoryWorkingSetBytes: false
        k8sPodOwner: false
This will prevent the default rules from being created, and then you can simply create the patched rules yourself by adding a PrometheusRule resource in the monitoring namespace:
# Forked from upstream https://github.com/prometheus-community/helm-charts/blob/kube-prometheus-stack-52.1.0/charts/kube-prometheus-stack/templates/prometheus/rules-1.14/k8s.rules.yaml
# Removed filters on specific job names as they assume Prometheus implementation details
# and do not work with metrics pushed from different collectors.
apiVersion: monitoring.coreos.com/v1
kind: PrometheusRule
metadata:
  name: prometheus-k8s.rules
  namespace: monitoring
spec:
  groups:
  - name: k8s.rules
    rules:
    - expr: |-
        sum by (cluster, namespace, pod, container) (
          irate(container_cpu_usage_seconds_total{image!=""}[5m])
        ) * on (cluster, namespace, pod) group_left(node) topk by (cluster, namespace, pod) (
          1, max by(cluster, namespace, pod, node) (kube_pod_info{node!=""})
        )
      record: node_namespace_pod_container:container_cpu_usage_seconds_total:sum_irate
    - expr: |-
        container_memory_working_set_bytes{image!=""}
        * on (cluster, namespace, pod) group_left(node) topk by(cluster, namespace, pod) (1,
          max by(cluster, namespace, pod, node) (kube_pod_info{node!=""})
        )
      record: node_namespace_pod_container:container_memory_working_set_bytes
    - expr: |-
        container_memory_rss{image!=""}
        * on (cluster, namespace, pod) group_left(node) topk by(cluster, namespace, pod) (1,
          max by(cluster, namespace, pod, node) (kube_pod_info{node!=""})
        )
      record: node_namespace_pod_container:container_memory_rss
    - expr: |-
        container_memory_cache{image!=""}
        * on (cluster, namespace, pod) group_left(node) topk by(cluster, namespace, pod) (1,
          max by(cluster, namespace, pod, node) (kube_pod_info{node!=""})
        )
      record: node_namespace_pod_container:container_memory_cache
    - expr: |-
        container_memory_swap{image!=""}
        * on (cluster, namespace, pod) group_left(node) topk by(cluster, namespace, pod) (1,
          max by(cluster, namespace, pod, node) (kube_pod_info{node!=""})
        )
      record: node_namespace_pod_container:container_memory_swap
    - expr: |-
        kube_pod_container_resource_requests{resource="memory"}  * on (namespace, pod, cluster)
        group_left() max by (namespace, pod, cluster) (
          (kube_pod_status_phase{phase=~"Pending|Running"} == 1)
        )
      record: cluster:namespace:pod_memory:active:kube_pod_container_resource_requests
    - expr: |-
        sum by (namespace, cluster) (
            sum by (namespace, pod, cluster) (
                max by (namespace, pod, container, cluster) (
                  kube_pod_container_resource_requests{resource="memory"}
                ) * on(namespace, pod, cluster) group_left() max by (namespace, pod, cluster) (
                  kube_pod_status_phase{phase=~"Pending|Running"} == 1
                )
            )
        )
      record: namespace_memory:kube_pod_container_resource_requests:sum
    - expr: |-
        kube_pod_container_resource_requests{resource="cpu"}  * on (namespace, pod, cluster)
        group_left() max by (namespace, pod, cluster) (
          (kube_pod_status_phase{phase=~"Pending|Running"} == 1)
        )
      record: cluster:namespace:pod_cpu:active:kube_pod_container_resource_requests
    - expr: |-
        sum by (namespace, cluster) (
            sum by (namespace, pod, cluster) (
                max by (namespace, pod, container, cluster) (
                  kube_pod_container_resource_requests{resource="cpu"}
                ) * on(namespace, pod, cluster) group_left() max by (namespace, pod, cluster) (
                  kube_pod_status_phase{phase=~"Pending|Running"} == 1
                )
            )
        )
      record: namespace_cpu:kube_pod_container_resource_requests:sum
    - expr: |-
        kube_pod_container_resource_limits{resource="memory"}  * on (namespace, pod, cluster)
        group_left() max by (namespace, pod, cluster) (
          (kube_pod_status_phase{phase=~"Pending|Running"} == 1)
        )
      record: cluster:namespace:pod_memory:active:kube_pod_container_resource_limits
    - expr: |-
        sum by (namespace, cluster) (
            sum by (namespace, pod, cluster) (
                max by (namespace, pod, container, cluster) (
                  kube_pod_container_resource_limits{resource="memory"}
                ) * on(namespace, pod, cluster) group_left() max by (namespace, pod, cluster) (
                  kube_pod_status_phase{phase=~"Pending|Running"} == 1
                )
            )
        )
      record: namespace_memory:kube_pod_container_resource_limits:sum
    - expr: |-
        kube_pod_container_resource_limits{resource="cpu"}  * on (namespace, pod, cluster)
        group_left() max by (namespace, pod, cluster) (
         (kube_pod_status_phase{phase=~"Pending|Running"} == 1)
         )
      record: cluster:namespace:pod_cpu:active:kube_pod_container_resource_limits
    - expr: |-
        sum by (namespace, cluster) (
            sum by (namespace, pod, cluster) (
                max by (namespace, pod, container, cluster) (
                  kube_pod_container_resource_limits{resource="cpu"}
                ) * on(namespace, pod, cluster) group_left() max by (namespace, pod, cluster) (
                  kube_pod_status_phase{phase=~"Pending|Running"} == 1
                )
            )
        )
      record: namespace_cpu:kube_pod_container_resource_limits:sum
    - expr: |-
        max by (cluster, namespace, workload, pod) (
          label_replace(
            label_replace(
              kube_pod_owner{owner_kind="ReplicaSet"},
              "replicaset", "$1", "owner_name", "(.*)"
            ) * on(replicaset, namespace) group_left(owner_name) topk by(replicaset, namespace) (
              1, max by (replicaset, namespace, owner_name) (
                kube_replicaset_owner
              )
            ),
            "workload", "$1", "owner_name", "(.*)"
          )
        )
      labels:
        workload_type: deployment
      record: namespace_workload_pod:kube_pod_owner:relabel
    - expr: |-
        max by (cluster, namespace, workload, pod) (
          label_replace(
            kube_pod_owner{owner_kind="DaemonSet"},
            "workload", "$1", "owner_name", "(.*)"
          )
        )
      labels:
        workload_type: daemonset
      record: namespace_workload_pod:kube_pod_owner:relabel
    - expr: |-
        max by (cluster, namespace, workload, pod) (
          label_replace(
            kube_pod_owner{owner_kind="StatefulSet"},
            "workload", "$1", "owner_name", "(.*)"
          )
        )
      labels:
        workload_type: statefulset
      record: namespace_workload_pod:kube_pod_owner:relabel
    - expr: |-
        max by (cluster, namespace, workload, pod) (
          label_replace(
            kube_pod_owner{owner_kind="Job"},
            "workload", "$1", "owner_name", "(.*)"
          )
        )
      labels:
        workload_type: job
      record: namespace_workload_pod:kube_pod_owner:relabel
The final step is configuring the Helm chart to pick up all PrometheusRule objects in the monitoring namespace, by setting:
spec:
  values:
    prometheus:
      prometheusSpec:
        ruleSelectorNilUsesHelmValues: false
Once this is done, the default rule won't be created by the Helm chart anymore, and Prometheus will instead pick up the new rule, which does not have the additional filters. Recording rules are applied during the write stage, so only metrics values reported after the change is done will be corrected.
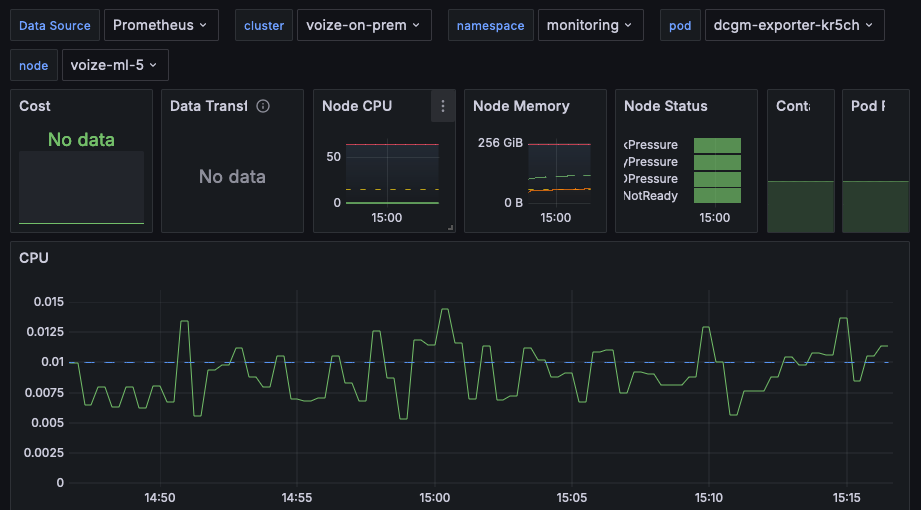
You should be able to refresh your dashboards/charts after a few seconds and see the metrics show up correctly from both sources:
;}.cls-6{fill:none;}.cls-7{fill:%2339f;}%3c/style%3e%3cclipPath%20id='clippath'%3e%3cpath%20class='cls-6'%20d='m681.73,372.35c0,282.5-286.05,445.9-424.39,507.51v-179.27C111.37,662.76,3.6,530.13,3.6,372.35,3.6,185.08,155.41,33.28,342.67,33.28s339.07,151.81,339.07,339.07h-.01Z'/%3e%3c/clipPath%3e%3c/defs%3e%3cg%20class='cls-2'%3e%3cg%20class='cls-2'%3e%3cpath%20d='m997.93,666.39l-152-386.4h129.6l87.2,244.8,88-244.8h130.4l-152,386.4h-131.2Z'/%3e%3cpath%20d='m1292.32,472.79c0-108.8,79.2-202.4,210.4-202.4s211.2,93.6,211.2,202.4-78.4,203.2-211.2,203.2-210.4-94.4-210.4-203.2Zm295.2,0c0-51.2-30.4-93.6-84.8-93.6s-83.2,42.4-83.2,93.6,29.6,94.4,83.2,94.4,84.8-42.4,84.8-94.4Z'/%3e%3cpath%20d='m1769.91,160.79c0-39.2,31.2-70.4,70.4-70.4s70.4,31.2,70.4,70.4-31.2,70.4-70.4,70.4-70.4-31.2-70.4-70.4Zm8.8,505.6v-386.4h123.2v386.4h-123.2Z'/%3e%3cpath%20d='m1977.1,666.39v-90.4l155.2-188.8h-155.2v-107.2h322.4v87.2l-158.4,192.8h161.6v106.4h-325.6Z'/%3e%3cpath%20d='m2557.89,270.39c114.4,0,197.6,84,197.6,215.2v26.4h-275.2c7.2,36,40.8,68.8,98.4,68.8,34.4,0,72.8-13.6,94.4-32.8l52,76.8c-38.4,34.4-102.4,51.2-161.6,51.2-119.2,0-211.2-77.6-211.2-203.2,0-112,84.8-202.4,205.6-202.4Zm-79.2,161.6h159.2c-3.2-27.2-23.2-66.4-80-66.4-53.6,0-74.4,38.4-79.2,66.4Z'/%3e%3c/g%3e%3c/g%3e%3cg%20class='cls-5'%3e%3cg%3e%3ccircle%20id='c3'%20class='cls-3'%20cx='253.67'%20cy='433.07'%20r='484.38'/%3e%3ccircle%20id='c2'%20class='cls-4'%20cx='83.67'%20cy='428.07'%20r='484.38'/%3e%3ccircle%20id='c1'%20class='cls-7'%20cx='-36.33'%20cy='494.63'%20r='484.38'/%3e%3ccircle%20id='c0'%20class='cls-1'%20cx='-141.33'%20cy='604.68'%20r='484.38'/%3e%3c/g%3e%3c/g%3e%3c/svg%3e)